Center for Earth Observing and Spatial Research


Monitoring in 3D: Typhoon Sinlaku (2026)

In April 2026, Typhoon Sinlaku impacted the Pacific Islands of Guam, Saipan, and Tinian. As the storm approached the islands and made landfall, NASA’s Global Precipitation Measurement mission (GPM) satellite and multi-satellite data-processing algorithms gave insights into the rain that fell from this powerful storm. Now, learn how GPM helps us go beyond individual snapshots of surface rainfall by observing Typhoon Sinlaku over time and through the depth of Earth’s atmosphere.

The Time Dimension

Because of technological limitations, satellite instruments that see into a storm don’t hover over one place on Earth. Instead, they capture a snapshot of a storm as the satellite rapidly orbits the planet at a speed of about 5 miles per second. To build up the life story of an individual storm, it is necessary to stitch together observations from many satellites. Since 2014, NASA has done so by running the IMERG multi-satellite precipitation-estimation algorithm, which NASA developed in collaboration with scientists at other agencies and universities.

The movie below shows seven days of rainfall from Typhoon Sinlaku. This animation is built up from estimates made every 30 minutes from April 10 through April 16. In this movie, the transparent gray clouds represent Geosynchronous infrared satellite observations and the rainfall rate shown in color comes from NASA’s IMERG algorithm. These IMERG estimates can be viewed in NASA’s RAIN-Global 2 web tool or on the WorldView webpage.

These 30-minute surface rainfall rates can be summed to arrive at the storm-total rainfall accumulation. The public, businesses, and disaster agencies care about storm totals, not just when a storm will hit, so accumulation comes up in weather discussions. At about 2PM EDT (01800 UTC) on April 13, the National Weather Service office for the island of Guam warned the public that Typhoon Sinlaku could bring 15 to 25 inches of rain to the nearby Pacific islands of Saipan and Tinian in the subsequent days.  In its hurricane local statement, the Guam office said that passive-microwave satellite observations influenced their prediction.

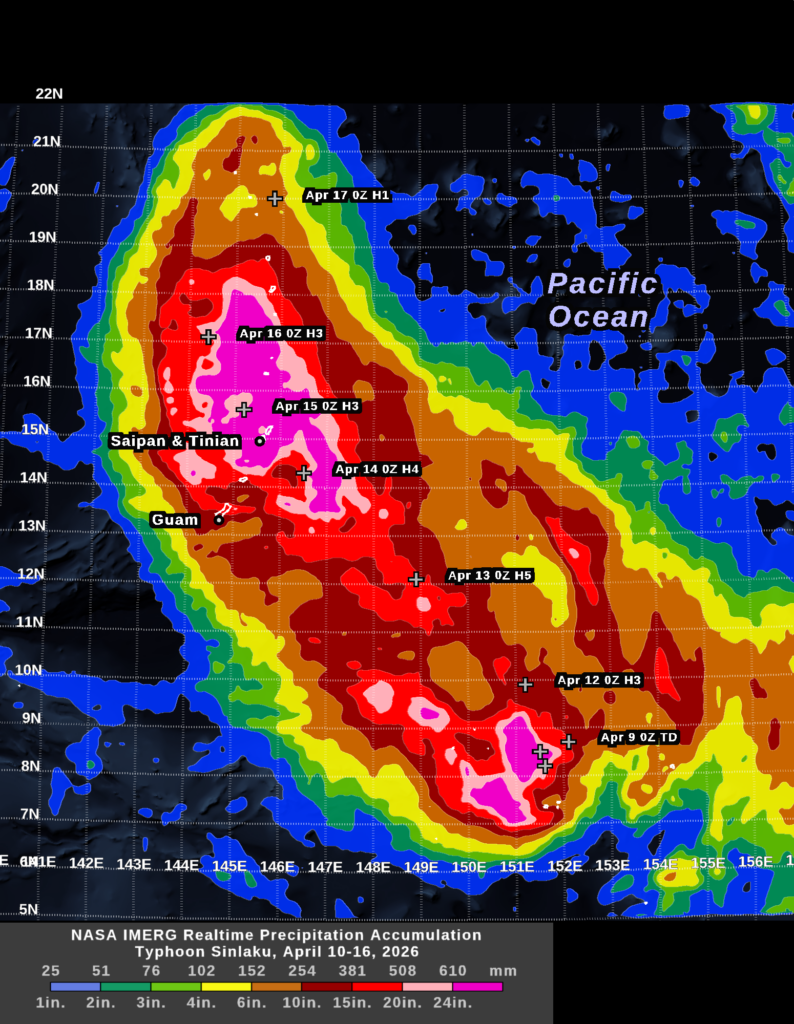
The 7-day accumulation shown above is one way to illustrate how the National Weather Service may have arrived at its 15-to-25-inch forecast.  During the two days before Typhoon Sinlaku reached Saipan and Tinian, the IMERG algorithm estimated that the storm was dumping about 6 to 20 inches of rainfall along the portion of its track southeast of these islands. This range is shown in orange and red in the image. The typhoon’s forward speed was cut in half around the time it started impacting Saipan and Tinian, which would increase the time it would spend over these islands. Other factors remaining equal, a slower forward speed would proportionally increase the expected rainfall total. Where the storm center passed with a slow forward motion (during April 14–15), IMERG estimated that the accumulation was 20 to 30 inches (pink and magenta in the image).

In the 7-day accumulation image, the location of Sinlaku’s center is marked with a white plus sign at 0000 UTC, each day. The storm’s strength is indicated by H1 through H5 for categories 1–5 on the Saffir-Simpson scale or by TD, which stands for Tropical Depression.  

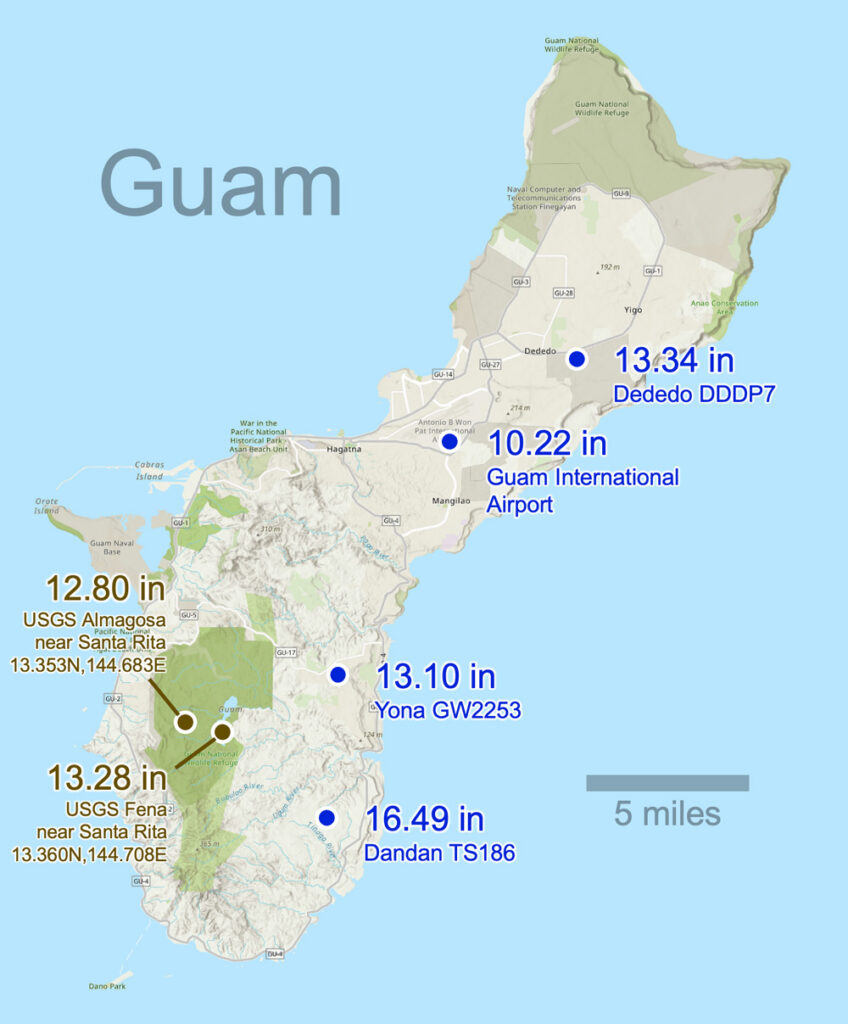
One way to increase confidence in these near real-time IMERG storm totals is to compare them to near real-time rain-gauge observations where available.  Rain-gauge data is not available immediately following Typhoon Sinlaku’s landfall for the two islands most severely impacted, Saipan and Tinian. However, just 130 miles to the south, several rain gauges in Guam continued to operate during the passage of Typhoon Sinlaku.  Between April 9 and 17, the National Weather Service and the USGS reported that six rain gauges in Guam had accumulations of 10.2 to 16.5 inches, respectively, including at Almagosa, Dededo, and Santa Rita. The map below shows the location of these gauges. IMERG reported 10 to 20 inches of accumulation over Guam, which indicates good agreement with these gauges. 

The Third Dimension

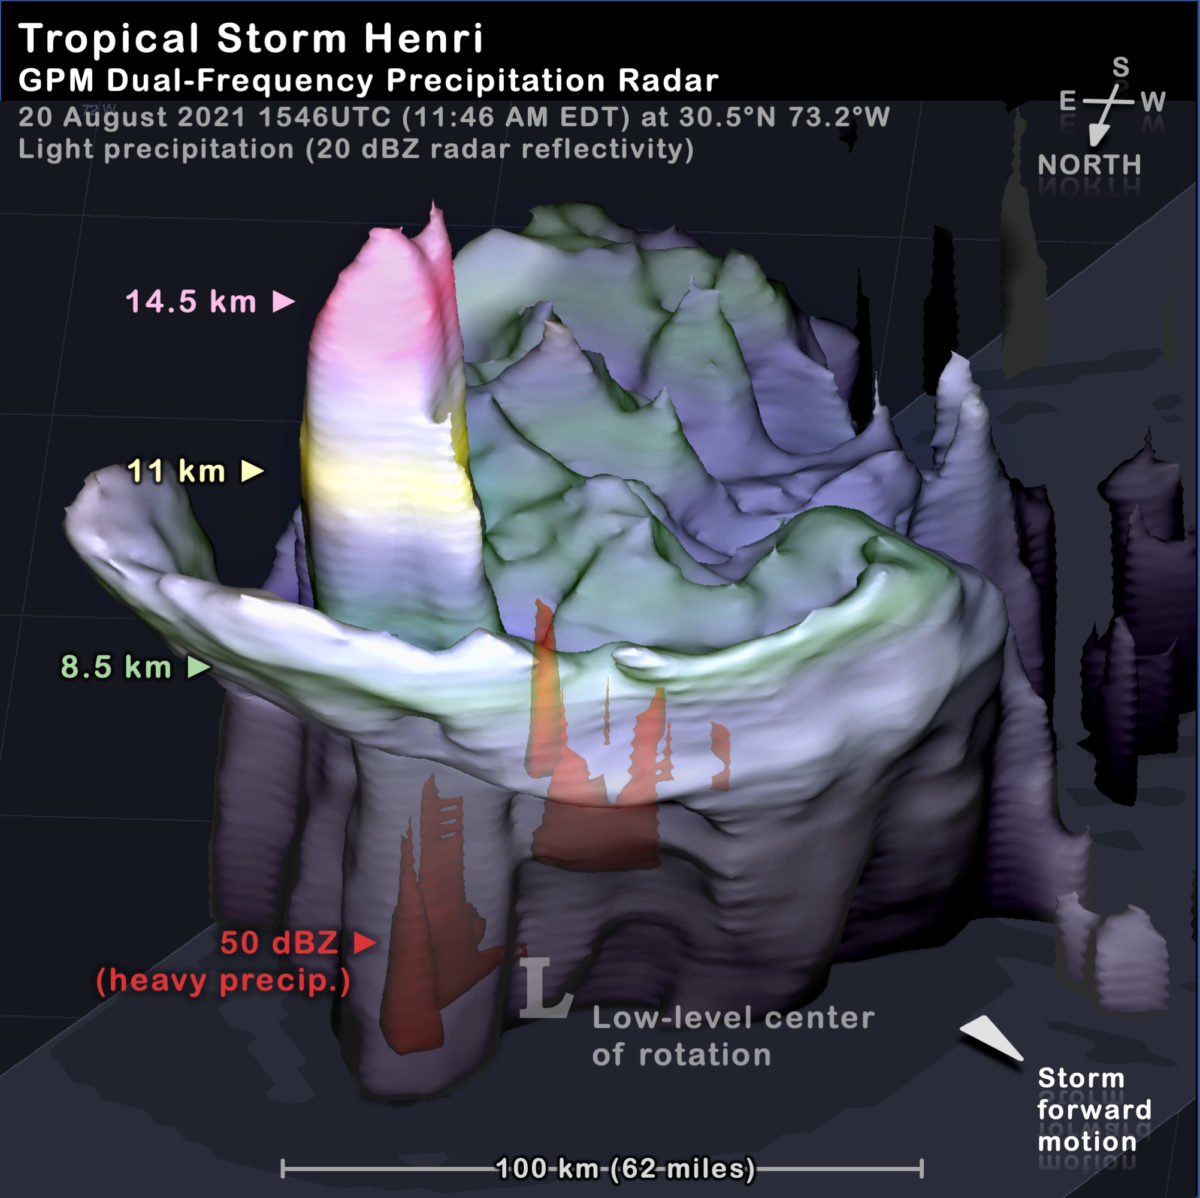
NASA’s Global Precipitation Measurement (GPM) Measurement satellite carries a radar built by Japan that is currently the only instrument in space able to observe the three-dimensional structure of storms. A few other cloud or precipitation radars are also in space, but they collect only two-dimensional curtains of data with data collected along the satellite’s direction of motion and vertically. The EarthCare and Tomorrow.IO satellites carry such 2D radars. Other satellite instruments collect different types of 2D data. Passive microwave instruments see into and through a storm, producing an image somewhat like a medical X-ray of the body. Infrared satellite instruments see only the top surface of a storm cloud, something like a hand-held infrared thermometer taking your temperature when pointed at your forehead. 

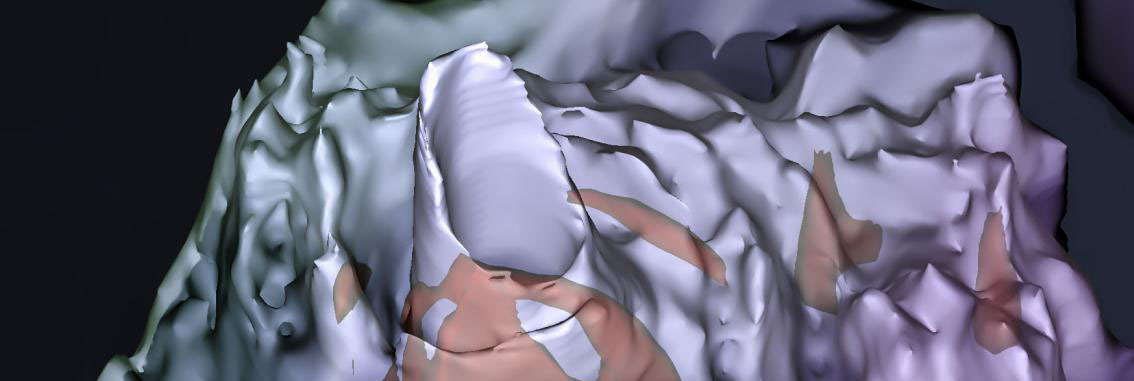
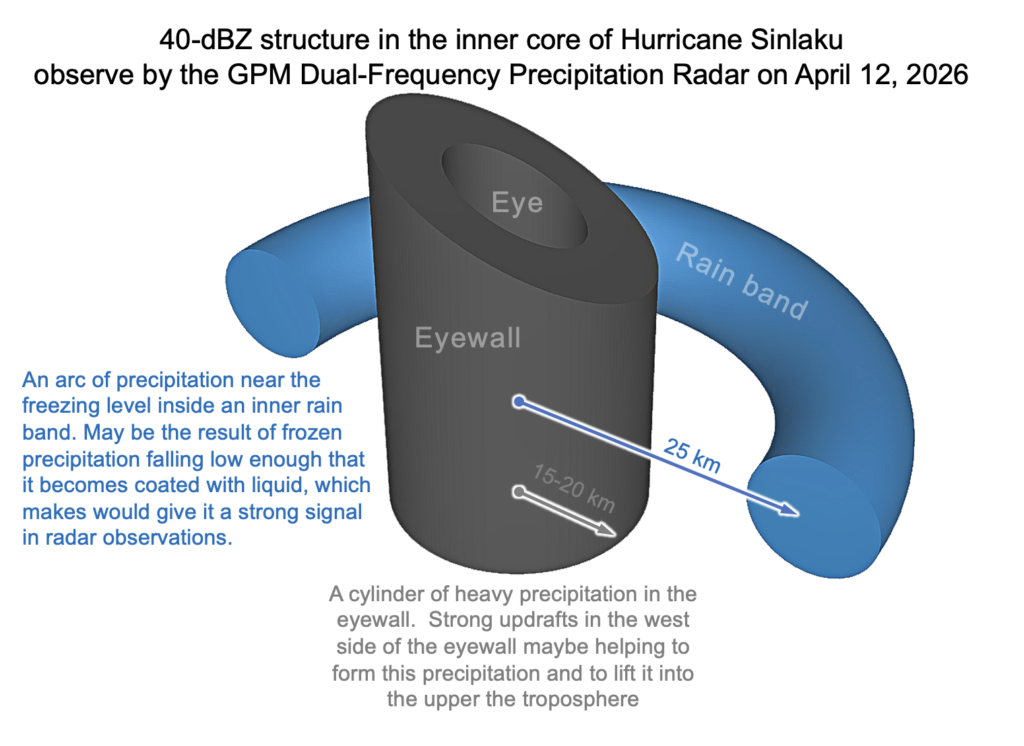
The dual-frequency radar on the GPM satellite flew over Typhoon Sinlaku’s eyewall on April 12, 2026. At 1208 UTC that day, the typhoon had reached category 5 on the Saffir-Simpson scale and would soon reach its peak wind intensity.

Above, the 3D image shows the radar-observed volume of the light precipitation inside Typhoon Sinlaku. Light precipitation is represented by the blue-gray surface. To a first approximation, the precipitation in the lower half of the hurricane (within 5 km of sea level) takes the form of raindrops. Above that, there are various forms of frozen precipitation because the atmosphere is so cold at those altitudes. The blue-gray surface is defined by a 20-dBZ radar-reflectivity threshold. Inside this surface, there is in inner volume of heavy precipitation that the image shows in red. The inner volume is defined by a stronger radar signal, i.e., a 40-dBZ threshold. Generally speaking, a radar signal this strong indicates heavy rainfall or large ice hydrometeors coated in liquid water as they fall through warm air.

One can gather clues about the updrafts and precipitation processes at work in the inner core of Typhoon Sinlaku by studying the shape of the radar echoes inside it. The following schematic diagram provides one interpretation of the 40-dBZ signal that the GPM DPR observed.

CEOSR at George Mason University assists the GPM science team with examining major precipitation events and evaluating and running precipitation-estimation algorithms. For more information about the GPM satellite and the IMERG algorithm, visit the GPM website: https://gpm.nasa.gov. Images and story by Owen Kelley (CEOSR). Animation by Jason West (NASA/PPS/KBR).

Hurricane Henri Fights Wind Shear on Approach to New England (August 2021)

Tropical Storm Henri (20 Aug 2021)
Larger image: click here

In the North Atlantic, the tropical system known as Henri reached hurricane status on Saturday, August 21, 2021.  At the time, it was approaching a landfall in New England. Between Friday and Sunday, Henri was observed three times by the Dual-frequency Precipitation Radar (DPR) on the core satellite of NASA’s Global Precipitation Measurement (GPM) mission.

The GPM satellite’s first two flyovers of Henri occurred just 10 hours apart and revealed a remarkably unchanging structure that was being impacted by wind shear.  A third overflight occurred a day later, when wind shear had abated and Henri had become more organized. The GPM mission’s observations, such as these, are processed in near real-time for use by weather agencies and researchers.

Above, the 3D image from the first overflight shows the volume of light precipitation associated with Henri at 1646 UTC (12:46 PM local time) on Friday (August 20), and the structure tells this chapter of Henri’s story. At this time, Henri’s center was approximately 750 miles south of the Connecticut coast.

Light precipitation is detected by a 20 dBZ radar reflectivity, with color-coded stripes indicating which portion of the precipitation reached an altitude of 8.5 km (green), 11 km (yellow), or 14.5 km (red) above the ocean surface. A letter “L” indicates the location of the system’s low-level center of rotation.

For several days, Henri had been battling strong wind shear.  Wind shear is when the horizontal wind near the Earth’s surface is blowing in a different direction or speed than the horizontal wind higher in the troposphere, the layer of the atmosphere that most storms are confined to. Henri’s low-level center of circulation was at its northern edge, with most of the precipitation occurring in a 100-kilometer-wide area to the south of the low-level center of circulation.  Wind shear can encourage the formation of strong convective cells in the inner core of a tropical system, but shear can also hamper those convective cell’s ability to strengthen that system.

Hot Towers and Heat Engines

In the first overflight of Henri on Friday morning, a “hot tower” convective cell was observed adjacent to the low-level circulation center, and this hot tower had strong enough updrafts to lift ice precipitation more than 16 kilometers (10 miles) above the ocean’s surface. Hot towers are convective cells with updrafts strong enough to lift precipitation up through the top of the troposphere.

A series of hot towers in the inner core of a tropical storm or hurricane indicates that a considerable amount of heat is being released inside the storm.  This heat could result in wind intensification if wind shear or other factors do not short circuit the process.

The second overflight of Henri (not shown) occurred late on Friday night, local time, which was early on Saturday morning in universal time (0232 UTC).  At that time, shear was still high and Henri still had a hot tower near its low-level center of rotation. By 11 AM Saturday morning (1500 UTC), shear had weakened and Henri had strengthened 5 knots to becoming a category-1 hurricane according to the National Hurricane Center.

Hurricanes are often said to contain “heat engines” because they convert some of the energy in the sun-warmed surface of the ocean into kinetic energy of the hurricane’s strong winds that rotate around its low-level center of rotation.  In this analogy, strong convective cells in the inner core of a hurricane are the pistons of its heat engine.

When a factor such as wind shear inhibits this energy conversion, one might say that all the pistons of the heat engine were firing but the engine wasn’t in gear.  In other words, vigorous convective cells were injecting heat into the atmosphere, but the hurricane could not convert that heat into a well defined eye circled by rapid winds.  This diagnosis of Henri is consistent with the two GPM satellite overflights during the 10-hour period on Friday, August 20.

Wind Shear Weaken,
Henri Strengthens into a Hurricane

Hurricane Henri (21 Aug 2021)
Larger Image: click here

As pictured above, the Dual-frequency Precipitation Radar flew over Henri for a third time late on Saturday night, local time (9:37 PM EDT), which was early Sunday morning in Universal Time (0137 UTC).  At this time, Henri’s center was approximately 230 miles south of the Connecticut coast. The precipitation of Henri’s inner core at this time was consistent with that of a weak hurricane. In this overflight, the DPR captured most but not all of the eye.  The precipitation along the southwest edge of the eye was outside of the field of view of the DPR.

On Sunday, Henri had an eye, an area at its center that was free from precipitation, and an eyewall, an arc of heavy precipitation around that eye.  Henri’s eyewall was relatively weak, with updrafts able to lift precipitation to less than 8 km altitude in most places.

In the Sunday morning overflight, there was, again, a hot tower near Henri’s center.  Given time and favorable circumstances, a series of hot towers in a hurricane’s eyewall can lead to intensification, according to NASA research.  For Hurricane Henri, further intensification was not forecast, nor did it occur, following this overflight.  Further intensification likely did not occur in part because Henri entered cold water off the coast of New England. Credits: Visualization and caption by O. Kelley.

Hurricane Laura’s Hot Tower (Aug. 2020)

Hurricane Laura (2020)

Two days before landfall, Laura had been forecasted to experience a period of weakening before landfall but instead, it ended up intensifying and deepening until its inner core was interacting with land.  Consistent with NHC reports of continued intensifying is 3D evidence from the GPM satellite that Laura’s eyewall contained vigorous convection at 0300 UTC, 3 hours before landfall.

In this overflight, GPM’s Dual-frequency Precipitation Radar (DPR) saw a 15-km-tall hot tower in the eyewall. An nearby convective cell within the eyewall was shorter but contained an impressively strong 50-dBZ radar reflectivity signal in the mid-troposphere. Both observations are indicative of strong updrafts in the eyewall.  In the image, a indicates the low-pressure center of the hurricane, also know as the eye because it is occasionally cloud free; b indicates the hot tower in the eyewall convection, and c indicates the region of extremely heavy precipitation in the eyewall.

A hot tower means that the eyewall’s updrafts were strong enough to lift small ice hydrometeors up and out of the troposphere, the layer of the atmosphere that usually contains storm systems.  The 50 dBZ mid-troposphere signal means that updrafts were strong enough that ice particles where held aloft long enough to grow large, perhaps hail-sized, despite their fall speed increasing as they grew larger.

GPM Satellite Observes a Hot Tower in Squall Line off Florida’s Coast (April 2020)

GPM DPR observes Hot Tower over Ocean 20 April 2020

At 9:26PM on Sunday April 19, 2020, NASA’s GPM satellite observed an extremely vigorous convective storm cell embedded within a squall line traveling in advance of a tornado-producing weather system. This system spawned tornadoes earlier that evening along the US Gulf Coast and 12 hours later over Florida. The GPM satellite flew over the portion of this squall line that extended over the Atlantic Ocean, 350 miles (500 kilometers) east of Florida’s Coast.

The Dual-Frequency Precipitation Radar (DPR) observed a storm cell whose updrafts were strong enough to lift small ice particles into the stratosphere, 15.8 km above the ocean surface. Equally remarkable is that the updrafts were able to lift large ice particles, perhaps including hail, to a 14.5 km altitude. In round numbers, the precipitation radar detects small and large precipitating ice particles by means of a radar reflectivity of 20 or 40 dBZ, respectively.

As documented in NASA research, it is unusual, but not unheard of, for a precipitation cell over the ocean to reach such a high altitude. The vast majority of storm cells over the ocean fail to reach such high altitudes because the ocean’s surface temperature does not heat up as much as mid-latitude land surfaces can, denying storm cells an extremely unstable, warm, near-surface layer of air. Visualization and caption by O. Kelley.

For more information:

GPM website, https://gpm.nasa.gov/.

Kelley, O. A., J. Stout, M. Summers, and E. J. Zipser, 2010: Do
the tallest convective cells over the tropical ocean have slow
updrafts? Monthly Weather Review, 138, doi:10.1175/2009MWR3030.1.

Samenow, J., et al.: 20 April 2020, 10:11AM: Outbreak of tornadoes
and severe storms slams South for second straight
Sunday. Washington Post. Available online at
https://www.washingtonpost.com/weather/2020/04/19/south-tornadoes-severe-storms/.

NOAA Storm Prediction Center, 20 April 2020: realtime preliminary
storm reports. Available online at
https://www.spc.noaa.gov/climo/reports/200420_rpts.html.

Fire and Ice: Intense Convection Observed at High Latitude by the GPM Satellite Radar and a Ground-based Lightning Network (Dec. 2018)

Books about lightning barely mention the polar regions, and books about polar regions don’t mention lightning.  There are societal impacts to the severe weather that often comes with lightning and with the forest fires that lightning can produce.  In Antarctica, climate and weather dynamics are poorly understood, and lightning studies might help identify the preferential locations for convective precipitation. In the present study, lightning storms located 60° to 67° from the Equator are examined using simultaneous observation of lightning and ice-phase precipitation, both produced by storm updrafts.  Hence, lightning is the “fire” and precipitation is the “ice.”

In December 2018, GMU researcher Owen Kelley and coauthors Jeremy Thomas, Natalia Solorzano, and Robert Holzworth (DigiPen Institute of Technology and University of Washington) presenting their finding about polar-region lightning at the American Geophysical Union’s annual conference.  Their presentation is available as a PDF file.

In thunderstorms 60°- 67° from the Equator, the lightning flash rate and the height that updrafts lift precipitation are seen to vary by hemisphere and by longitude.  At these high latitudes, the observations appear consistent between the GPM Dual-frequency Precipitation Radar (DPR) and the World Wide Lightning Location Network (WWLLN). Individual lightning storms are observed to have lightning that is co-located with areas of high-altitude radar echoes.  Four-year-total lightning flash counts and four-year-average radar-based precipitation characteristics show similar geographic variation.

Credits:

Kelley, O.A., J. N. Thomas, N. N. Solorzano, and R. Holzworth, 2018 Dec.: Fire and ice: Intense convective precipitation observed at high latitudes by the GPM satellite’s Dual-frequency Precipitation Radar (DPR) and the ground-based World Wide Lightning Location Network (WWLLN). poster presentation, H43F-2487, 2018 AGU annual meeting.

WWLLN data and antenna photograph provided by WWLLN / University of Washington.