NASA’s satellite-based estimate of global precipitation can provide valuable information to officials monitoring the many wildfires in Alaska this summer. Wildfires occur in Alaska each summer, but July 2019 was a particularly active month. Few rain gauges exist in the large tracts of Alaskan wilderness, making satellite-based precipitation estimates potentially more valuable for monitoring wildfire. Many wildfires in the Alaskan wilderness are monitored but allowed to burn themselves out. Monitoring triggers firefighting efforts when a fire threatens life, infrastructure, or locations with critical ecological resources.
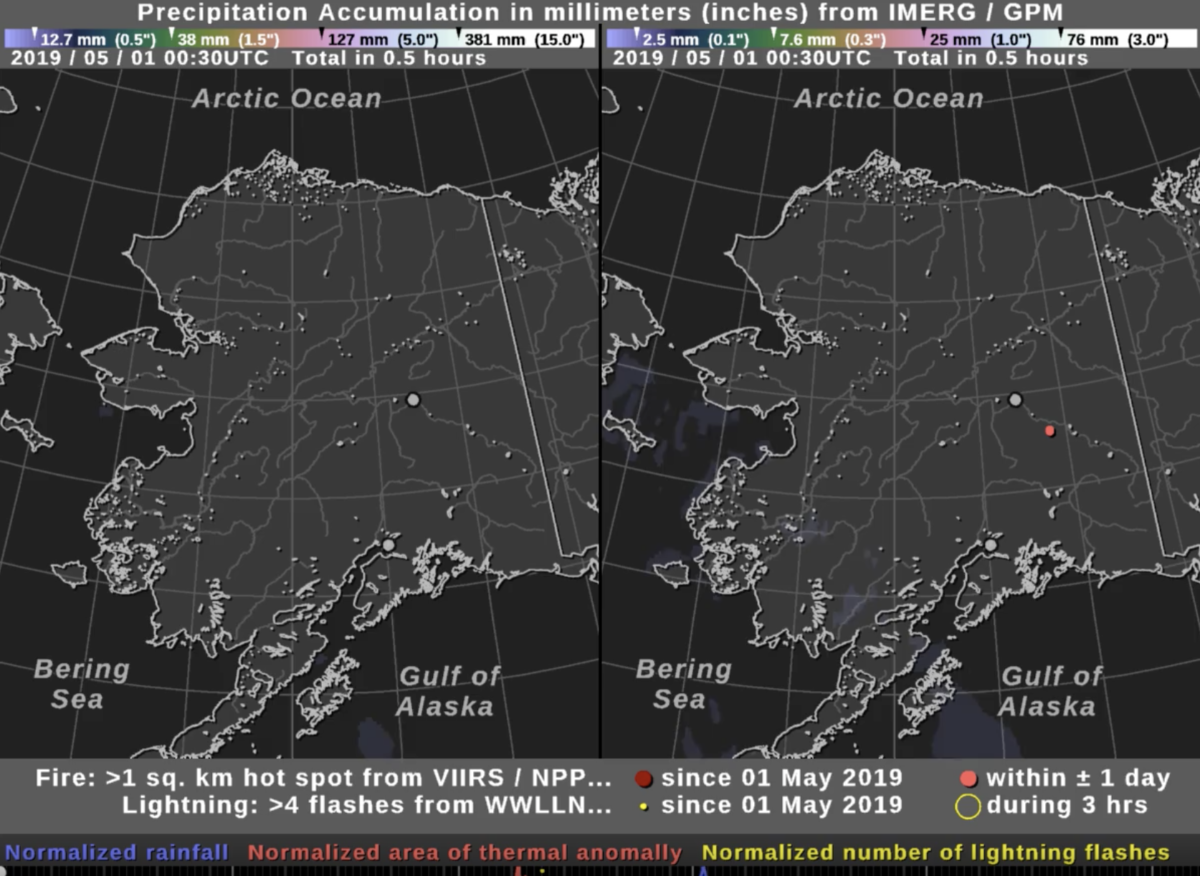
The movie shows NASA’s IMERG precipitation estimates for May through September, 2019. The total accumulation since May 1 is shown in millimeters (inches) on the left half, while the accumulation during a 3-hour period is shown on the right half. The locations of likely fires are shown in red, based on thermal anomalies observed by the VIIRS instrument on the Suomi NPP polar-orbiting satellite. The VIIRS “hot spot” data has a resolution of approximately 0.25 square kilometers and is based on infrared brightness temperature. Locations of lightning strikes are shown in yellow, as detected by the network of ground sensors that make up the World Wide Lightning Location Network. A flash is detected when five or more WWLLN stations around the world detect a radio-frequency atmospheric signal from the same lightning flash. A gray circle along the southern coast or center of Alaska represents the cities of Anchorage or Fairbanks, respectively.
The first part of the movie covers May 2019, and it is a period of little precipitation, little lightning, and few wildfires.
June 2019 shows an increasing amount of lightning but still few large fires. During June, the storms that do pass through central Alaska deliver only about half of the climatological normal amount of precipitation according to NOAA’s Climate Prediction Center.
At end of June and into July, things start to heat up. Numerous wildfires are present in Alaska even though regional storms reduced the intensity of some fires or put them out. One such storm passes through Alaska’s west coast on June 27 and another on July 1 near Fairbanks. During the first half of July, many wildfires burn. There is an absence of large storms coupled with significant lightning activity, which together contribute both to a dry fuel supply and lightning to ignite it.
By July 25, the U.S. Bureau of Land Management (BLM) reported that over 2 million acres of Alaska forests had burned so far this year, 98% of which were ignited by lightning rather than man-made fire sources. The area burned is equivalent to a square with sides 58 miles long.
Credits: For IMERG data, visit NASA’s Precipitation Measurement Missions (https://gpm.nasa.gov). The Visible Infrared Imaging Radiometer Suite (VIIRS) hot-spot data was downloaded from NASA’s Fire Information for Resource Management System (https://firms.modaps.eosdis.nasa.gov). Lightning data provided by University of Washington (https://www.wwlln.net). Climatological data provided by NOAA’s Climate Prediction Center (https://www.cpc.ncep.noaa.gov). Fire statistics from the Bureau of Land Management (https://fire.ak.blm.gov). Visualization by Owen Kelley at NASA Goddard’s Precipitation Processing System.