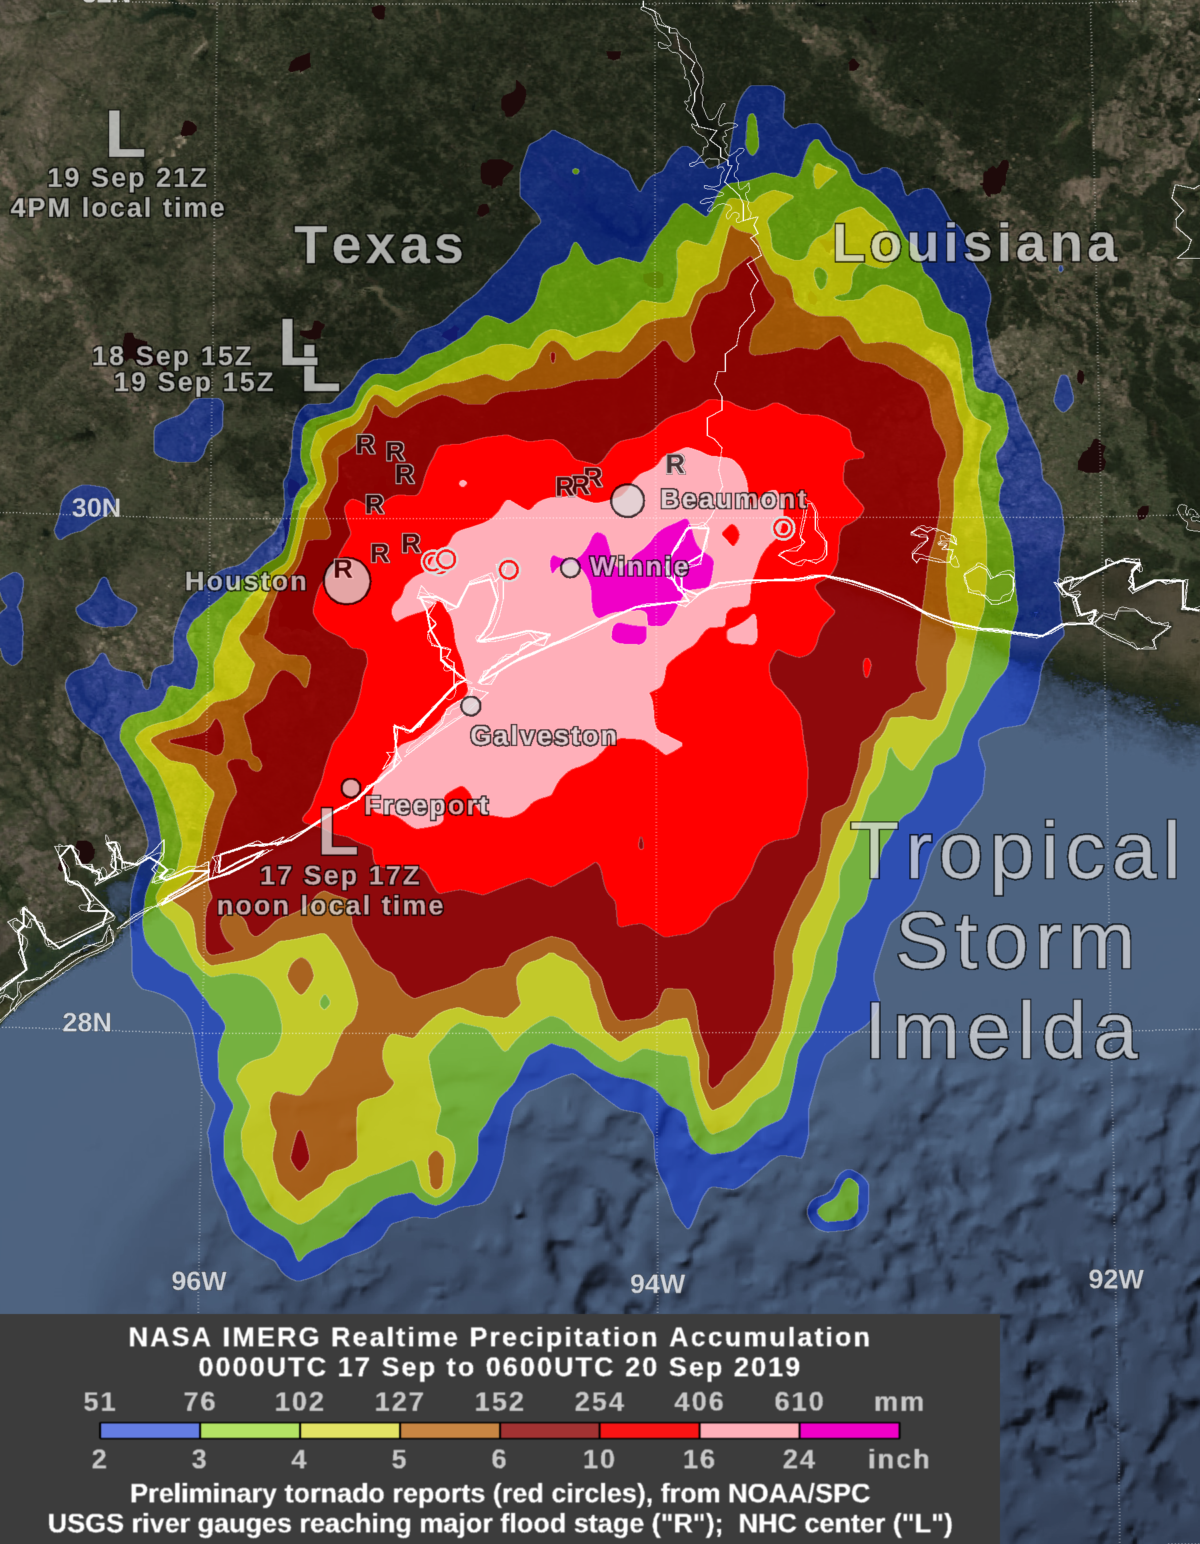

By Friday morning, September 20, the rainfall from the remnant of Tropical Storm Imelda had increased to over 24 inches in some areas near the Gulf of Mexico coast between Beaumont and Houston, Texas. This rainfall was in excess of what had been forcasted a few days earlier and was due to Imelda’s forward motion ceasing for approximately 24 hours between Wednesday and Thursday afternoon. The image shows, with large “L” symbols, the location estimated by the National Hurricane Center for Imelda’s low-pressure center of rotation at various times over the past three days.
This near-realtime rain estimate comes from the NASA’s IMERG algorithm, which combines observations from a fleet of satellites, in near-realtime, to provide near-global estimates of precipitation every 30 minutes.
If one compares the IMERG satellite-based rain estimate to that from a National Weather Service ground radar, one sees that IMERG correctly identified the large region of heavy rainfall near Beaumont, but IMERG failed to resolve an extremely narrow band of heavy rainfall along Galveston Island. Such good detection of large rain features in realtime would be impossible if the IMERG algorithm merely reported the precipitation observed by the periodic overflights of various agencies’ satellites. Instead, what the IMERG algorithm does is “morph” high-quality satellite observations along the direction of the steering winds to deliver information about rain at times and places where such satellite overflights did not occur. Information morphing is particularly important over the majority of the world’s surface that lacks ground-radar coverage.
An “R” symbol on the image indicates a place where the rainfall from the remnant of Imelda caused a US Geological Survey river gauge to swell to “major flood” stage. “Major” flood generally means that nearby homes and roads were flooded. The river-gauge data shown here is intended merely to give a hint of what areas experienced flooding and is not intended to portray the complete extent of flooding. In addition, there were several preliminary reports of Imelda-spawn tornados on Wednesday and Thursday, September 18-19. Red circles on this image indicate the location of these tornado reports, as provided by NOAA’s Storm Prediction Center. Visualization by NASA Goddard. Visualization and caption by O. Kelley.