Hurricane Dorian (2019) brought heavy rain to the Caribbean, along the US East Coast, and up to Canada. NASA satellite-based precipitation estimates tracked the storm throughout its lifetime, as shown by the sequence of images below.
September 3, 2019: Hurricane Dorian over Grand Bahama and Abaco Islands

In the early hours of Tuesday, September 3, Hurricane Dorian had been stationary over the island of Grand Bahama for 18 hours, most of the time as a category 5 hurricane. Storm-total rain accumulation over parts of Grand Bahama and Abaco islands have exceeded 24 inches according to NASA satellite-based estimates. On early Tuesday morning, Dorian’s central pressure has risen and its wind intensity had dropped to category 4 on the Saffir-Simpson scale. In addition, Dorian had experienced an eyewall replacement cycle on September 2, so by Tuesday morning, the geographic extent of its tropical-storm-force winds had expanded.
These rain estimates come from the NASA IMERG algorithm, which combines observations from a fleet of satellites, in near-realtime, to provide global estimates of precipitation every 30 minutes. The storm-total rainfall at a particular location varies with the forward speed of the hurricane, with the size of the hurricane’s wind field, and with how vigorous the updrafts are inside of the hurricane’s eyewall.
The graphic also shows the distance that tropical-storm force (39 mph) winds extend from Hurricane Dorian’s low-pressure center, as reported by the National Hurricane Center. The symbols H and TS represent a hurricane of various Saffir-Simpson categories or a tropical storm, respectively. Visualization by Owen Kelley (NASA/GMU).
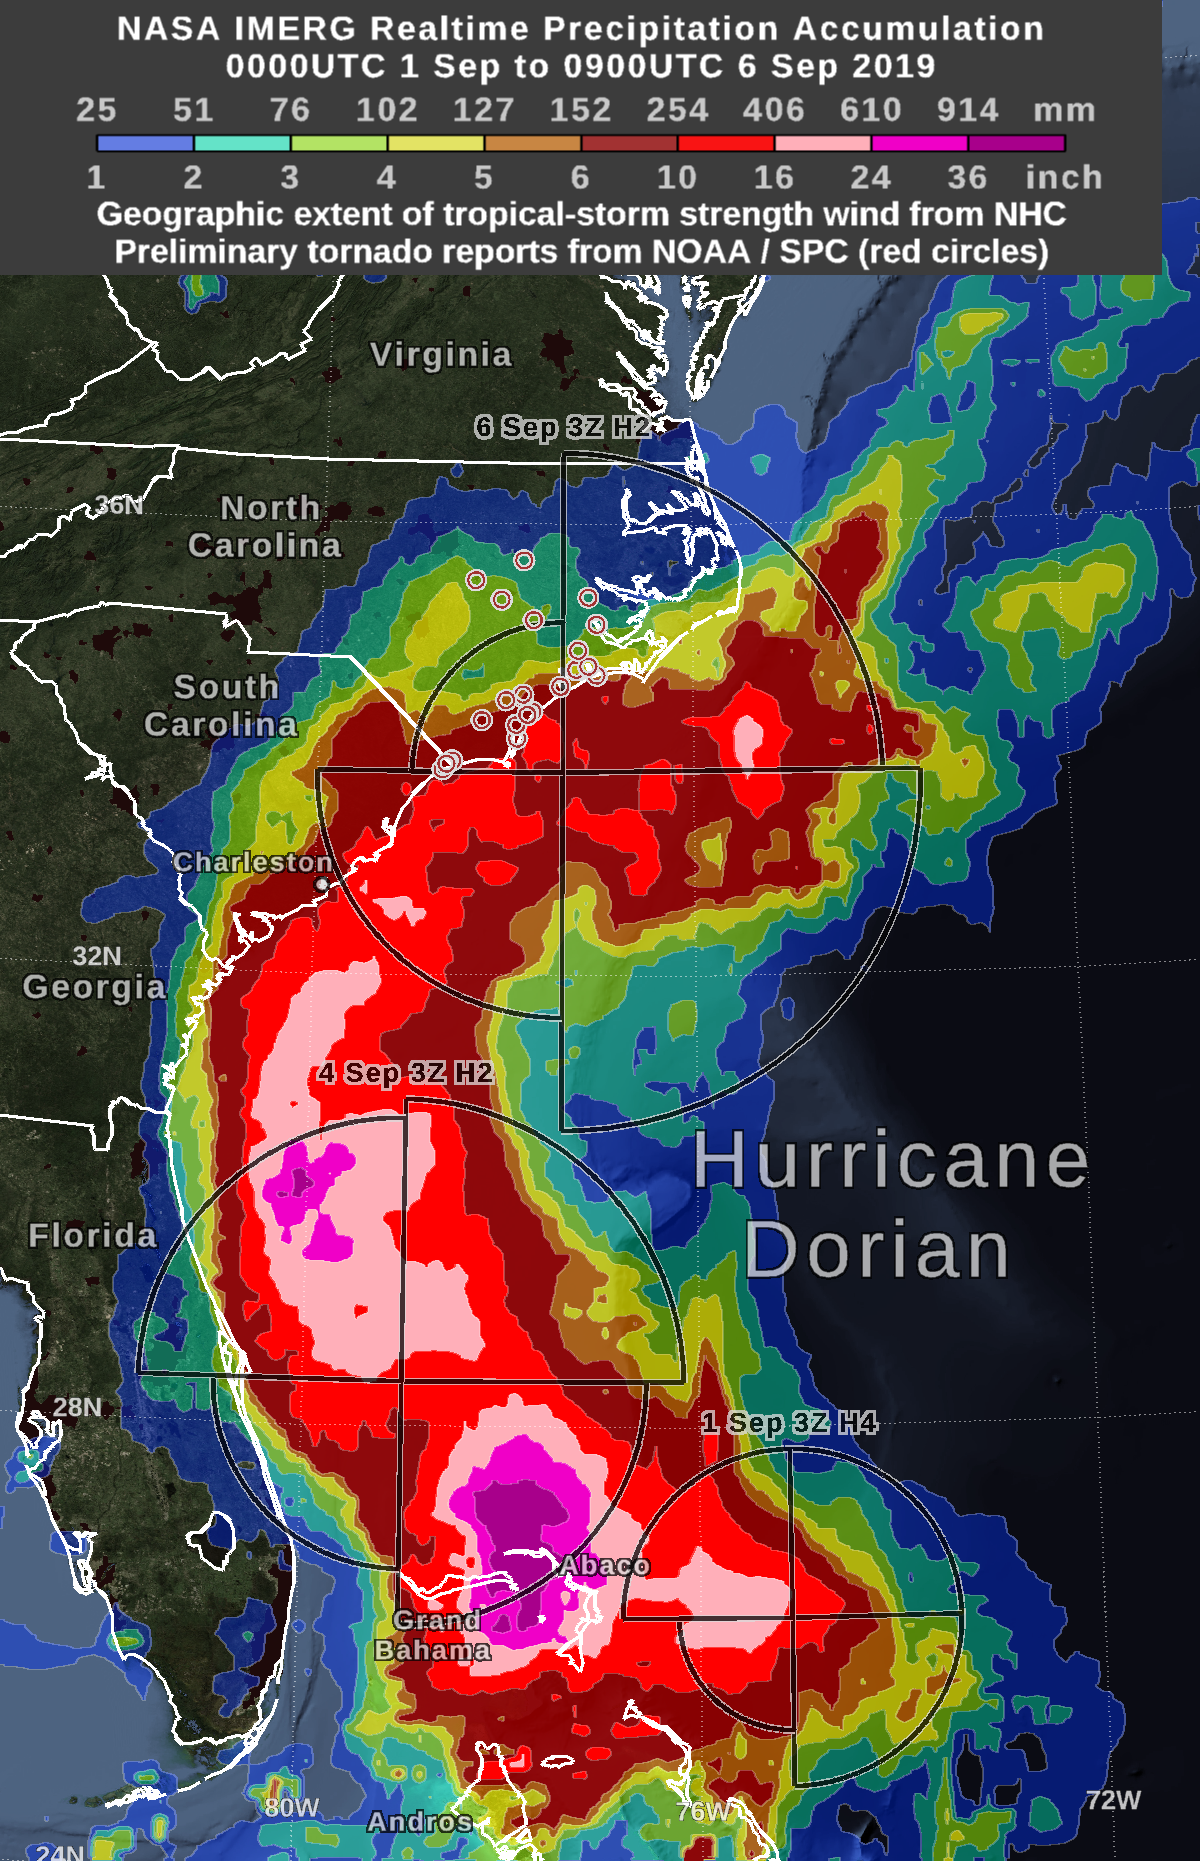
September 6, 2019: Hurricane Dorian Brings Tornadoes and Floods to the US East Coast

By Friday morning, September 6, Hurricane Dorian was located off the coast of North Carolina, having generated tornadoes the previous day as the northern rainband came ashore in North Carolina. NASA’s satellite-based realtime precipitation estimates suggest that, during the past day, most of the areas experiencing over 10 inches of rain accumulation remained offshore, while Dorian did drop heavy rain on South Carolina and North Carolina.
The preliminary reports of tornadoes were obtained from NOAA’s Storm Prediction Center, and are shown on the graphic as red circles. Since storm spotters are land based, these reports rarely capture any water spouts (tornado-like events over water) that might occur. As Hurricane Dorian interacted with the U.S. East Coast, the only tornado reports occurred from 4:50 AM to 5:00 PM EDT on September 5 in North and South Carolina. Scientists think of a hurricane as a heat engine that converts the warmth of the sun-warmed ocean into the kinetic energy of the hurricane’s strong, horizontal wind. When these strong winds reach land, the increased friction of the land surface vs. the ocean surface can convert some of this kinetic energy into tornadoes within the hurricane.
The near-realtime rain estimates come from the NASA’s IMERG algorithm, which combines observations from a fleet of satellites, in near-realtime, to provide global estimates of precipitation every 30 minutes. The storm-total rainfall at a particular location varies with the forward speed of the hurricane, with the size of the hurricane’s wind field, and with how vigorous the updrafts are inside the hurricane. This graphic only shows precipitation that fell starting at 0000UTC on September 1, and therefore does not show the precipitation that fell in late August, prior to Hurricane Dorian’s approach to The Bahamas.
The graphic shows the distance that tropical-storm force (39 mph) winds extend from Hurricane Dorian’s low-pressure center, as estimated by the National Hurricane Center. The Saffir-Simpson intensity category is the number following the “H” in the label on the image. Visualization by Owen Kelley (NASA/GMU).
September 9, 2019: Dorian Reaches Canada

On Monday morning, September 9, Hurricane Dorian was a post-tropical storm after a mid-latitude weather front and cold seas had altered its tropical characteristics over the weekend. On Saturday and Sunday, Hurricane Dorian struck eastern Canada, causing wind damage and bringing heavy rainfall. According to the Associated Press, a peak of 400,000 people were without power in Nova Scotia, Canada, because of Dorian.
This graphic shows precipitation that fell during the almost two-week period from August 27 to the early hours of September 9. The near-realtime rain estimates come from the NASA’s IMERG algorithm, which combines observations from a fleet of satellites, in near-realtime, to provide near-global estimates of precipitation every 30 minutes.
This year, NASA began running a improved version of the IMERG algorithm that does a better job estimating precipitation at high latitudes, specifically north of 60 degrees North latitude. The post-tropical remnant of Hurricane Dorian was approaching this cold region at the end of the period shown in this image. While the IMERG algorithm is still unable to estimate precipitation falling over ice-covered surfaces (such as Greenland), IMERG can now give a more complete picture of the water cycle in places such as Canada, which is, for the most part, free of snow cover at this time of year.
At one-day intervals, the image shows the distance that tropical-storm force (39 mph) winds extended from Hurricane Dorian’s low-pressure center, as estimated by the National Hurricane Center. The Saffir-Simpson hurricane-intensity category is the number following the “H” in the label on the image. “TS” or “PT” indicate times when the storm was either at tropical storm strength or when the storm was categorized as post-tropical.
Red circles over North Carolina indicate preliminary reports of tornados from 4:50 AM to 5:00 PM EDT on September 5, provided by NOAA’s Storm Prediction Center. Since storm spotters are land based, these reports rarely capture water spouts (tornado-like events over water) that may occur. Lines of latitude and longitude are curved on this map projection, as would be seen by an observer in Earth orbit, so that both tropical and arctic regions can be shown on the same map with minimal distortion. By combining NASA precipitation estimates with other data sources, we can gain a greater understanding of major storms that effect our planet. Visualization by O. Kelley.