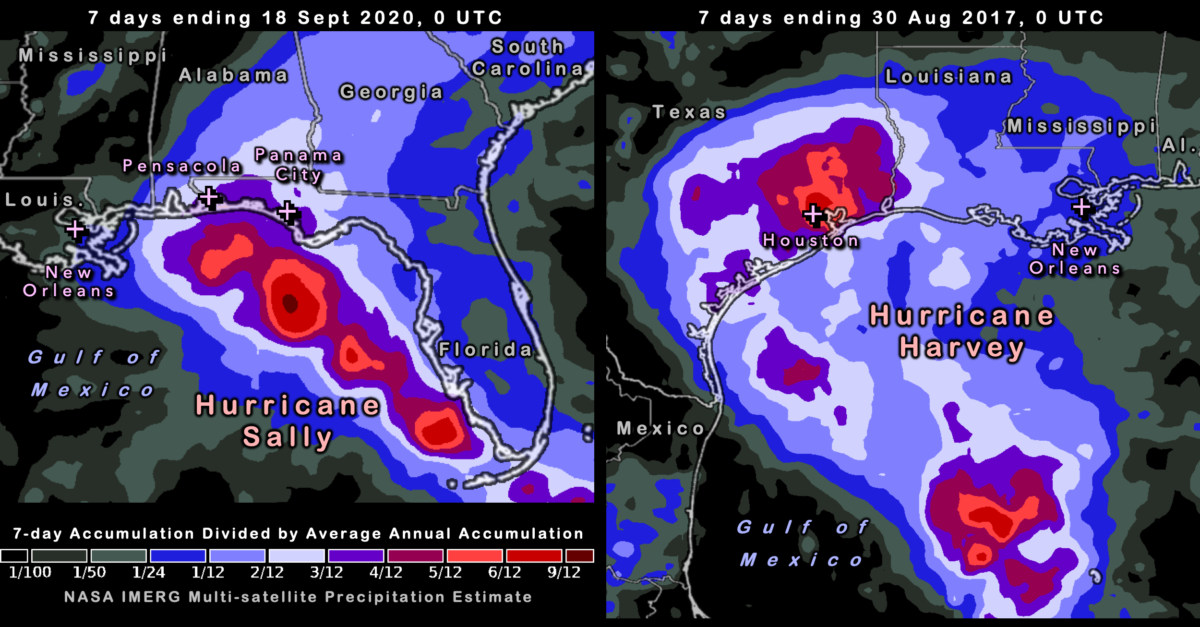

One way to put a storm into context is to compare its precipitation to the average annual accumulation at that location. The IMERG multi-satellite precipitation algorithm estimates that Hurricane Sally brought over 20 inches of precipitation to the coast of Florida’s Panhandle during the 7 days ending September 18, 2020, at 0000 UTC. That accumulation was equivalent to 25% to 33% of that area’s average annual precipitation. This area is indicated in purple on the left half of the image.
The coast of Florida’s Panhandle is the wettest area along the entire US East Coast and Gulf Coast. It receives approximately 60 to 68 inches of precipitation in an average year, based on 19 years of estimates made by the IMERG algorithm.
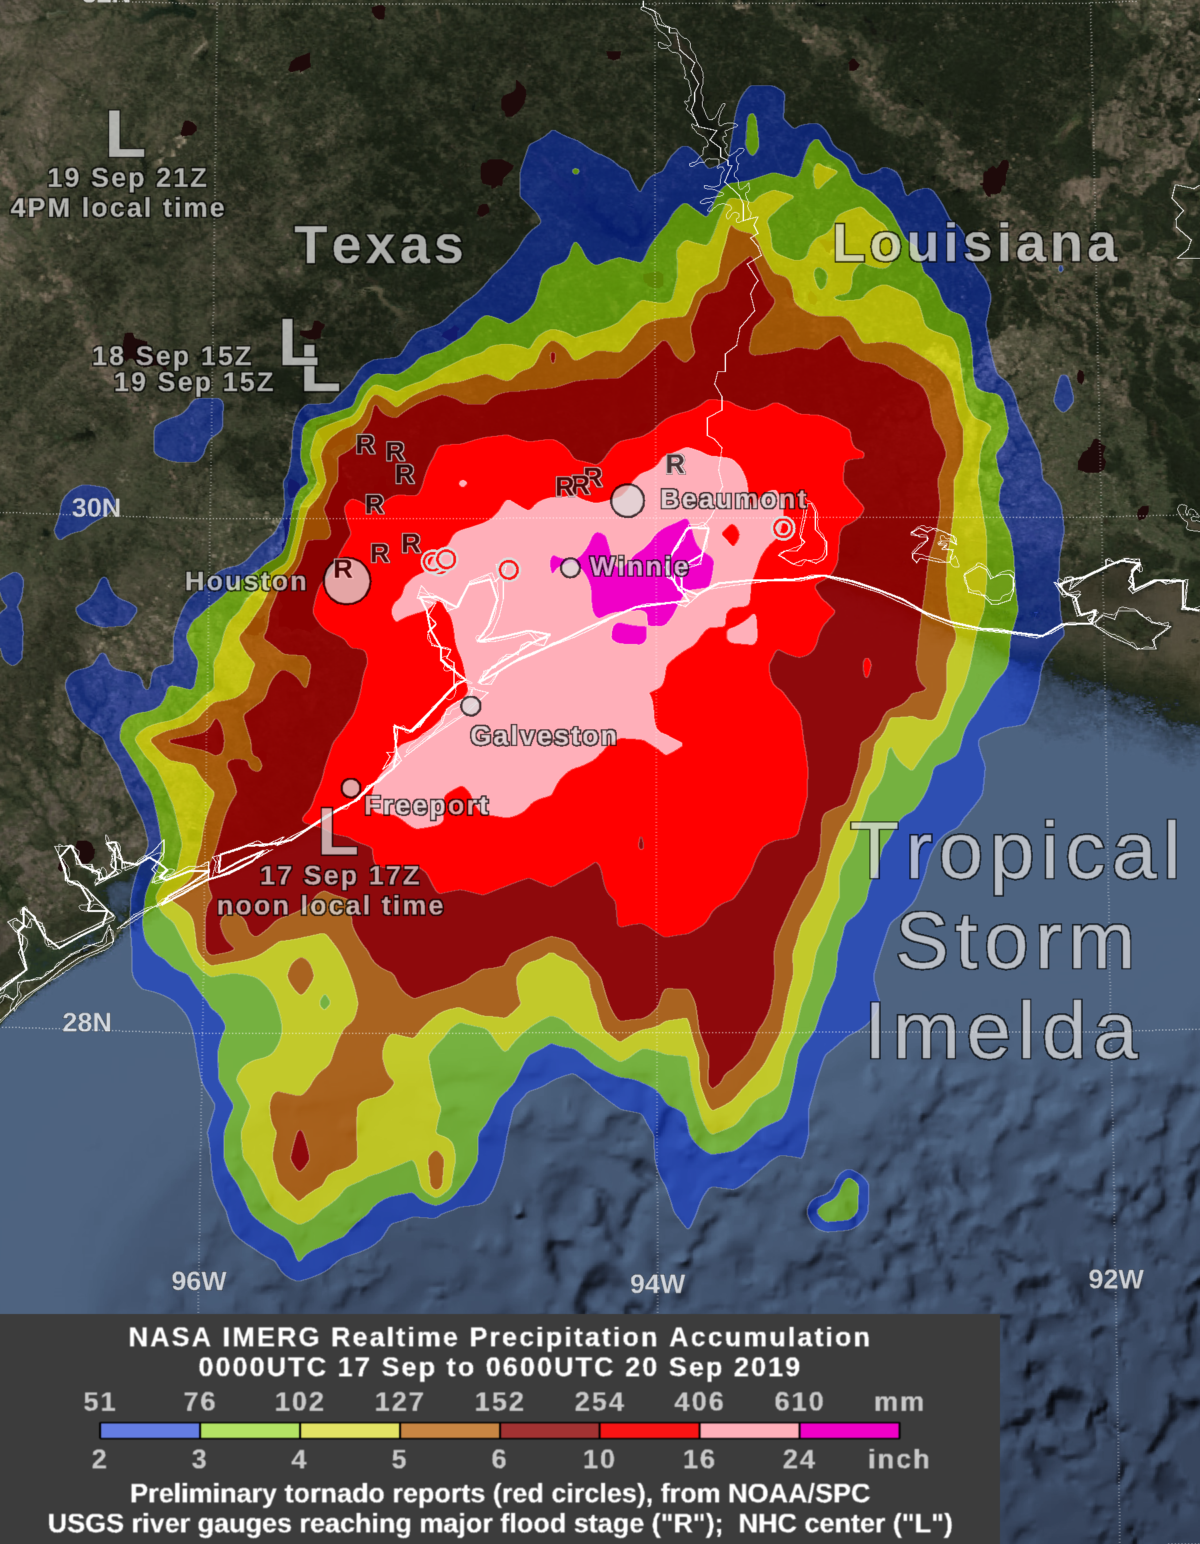
When it comes to hurricane flooding along the Gulf Coast, Hurricane Sally does not top Hurricane Harvey which made landfall in late August, 2017. Like Sally, Harvey also dumped over 20 inches of rainfall, but over a larger area that included a major metropolitan area. Specifically, this area of southeastern Texas includes Houston, Texas, a city that typically averages approximately 55 to 60 inches of precipitation a year. In Houston, the 7-day accumulation from Hurricane Harvey was 50% to 75% of the city’s average annual accumulation. This area is indicated in red on the right half of the image. Houston area flooding contributed to Hurricane Harvey being one of the most costly hurricanes in US history.
Our ability to interpret near real-time estimates of precipitation over both land and ocean is assisted by the availability of a reference data set of 19 years of global precipitation estimates made by the same IMERG algorithm. Visualization and caption by O. Kelley.


