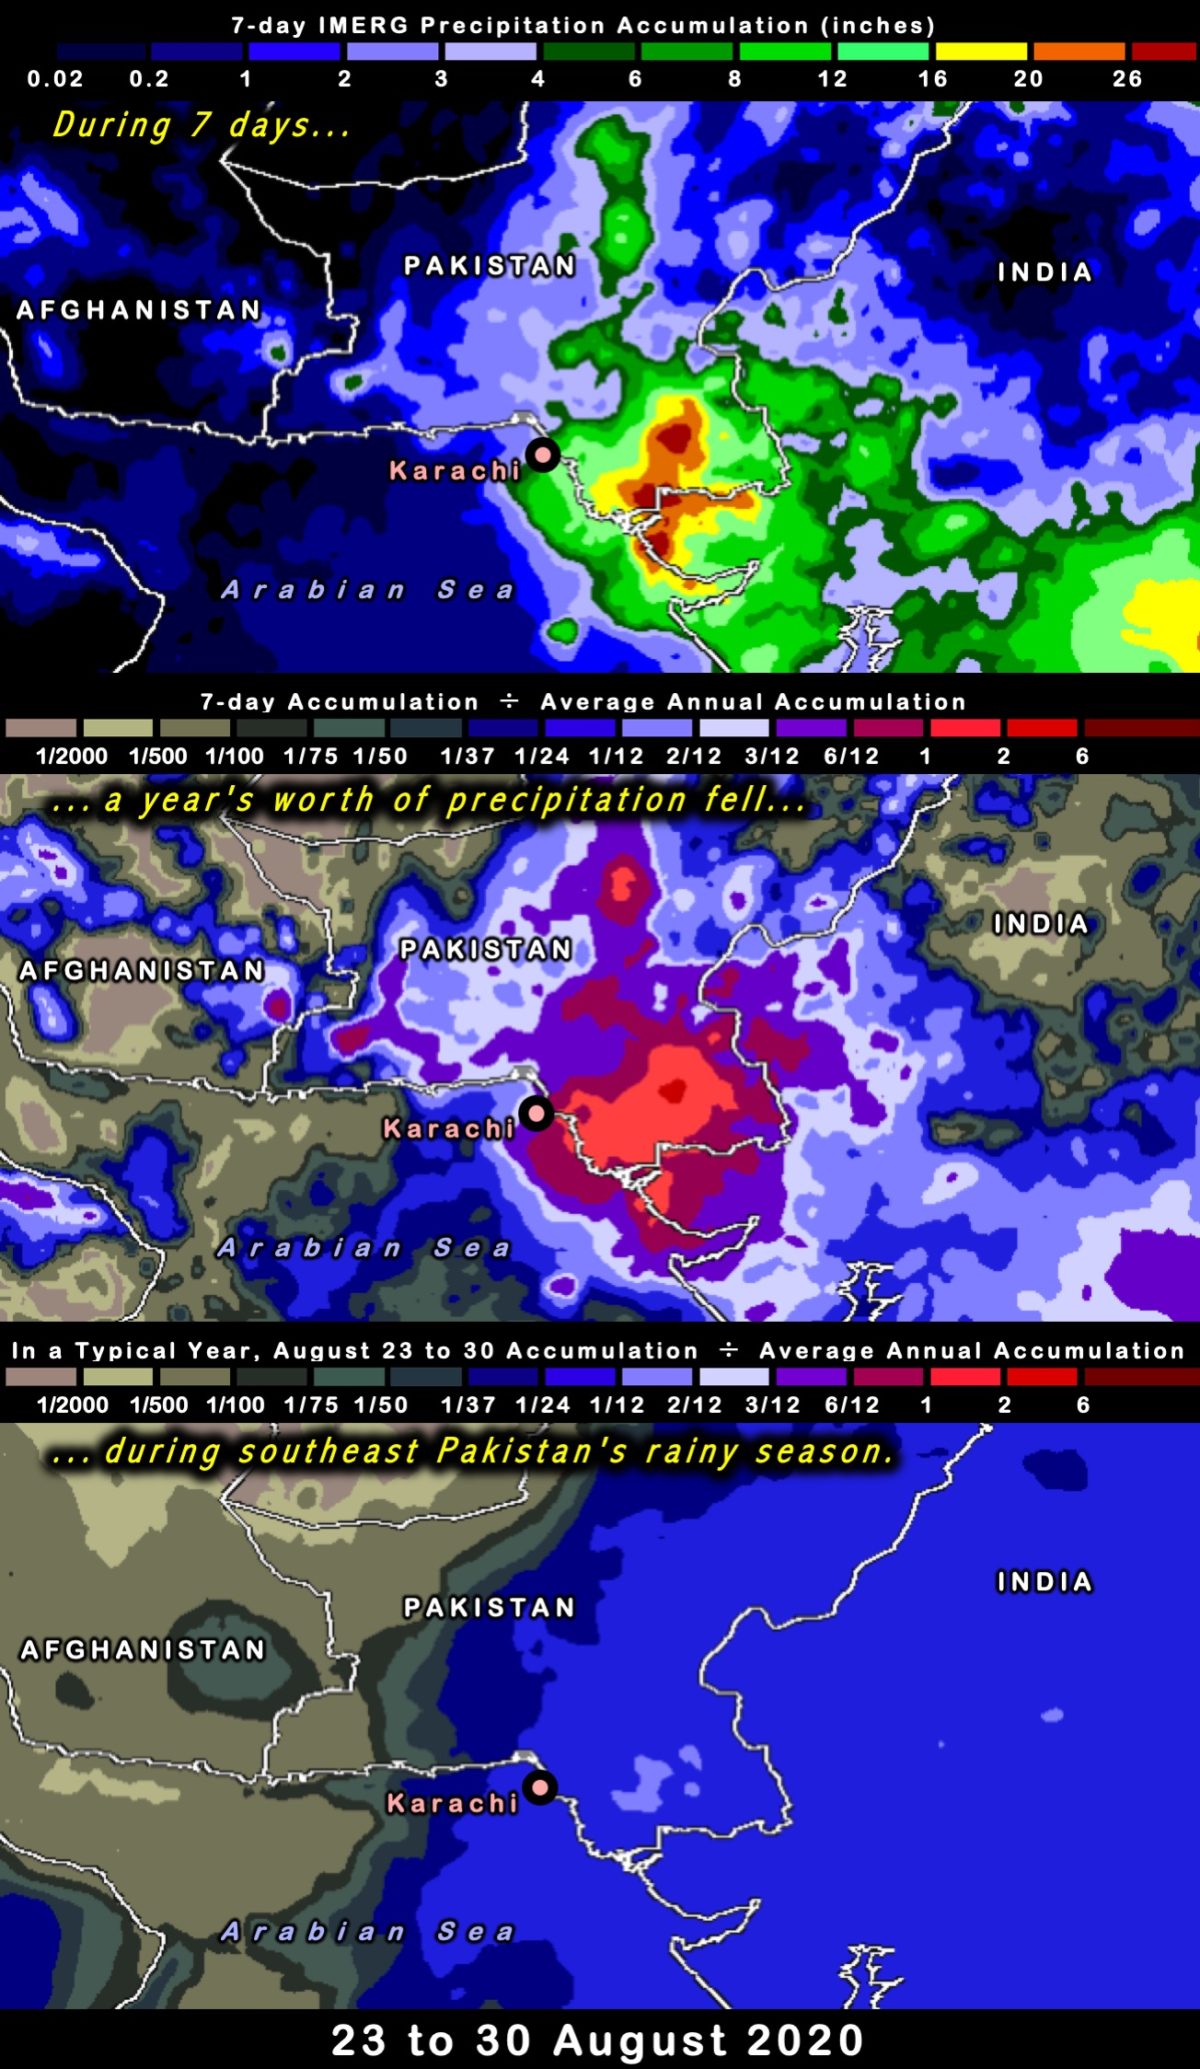
Categories
News

Alaska’s Wildfires, Precipitation, and Lightning (summer 2019)

NASA’s satellite-based estimate of global precipitation can provide valuable information to officials monitoring the many wildfires in Alaska this summer. Wildfires occur in Alaska each summer, but July 2019 was a particularly active month. Few rain gauges exist in the large tracts of Alaskan wilderness, making satellite-based precipitation estimates potentially more valuable for monitoring wildfire. Many wildfires in the Alaskan wilderness are monitored but allowed to burn themselves out. Monitoring triggers firefighting efforts when a fire threatens life, infrastructure, or locations with critical ecological resources.

The movie shows NASA’s IMERG precipitation estimates for May through September, 2019. The total accumulation since May 1 is shown in millimeters (inches) on the left half, while the accumulation during a 3-hour period is shown on the right half. The locations of likely fires are shown in red, based on thermal anomalies observed by the VIIRS instrument on the Suomi NPP polar-orbiting satellite. The VIIRS “hot spot” data has a resolution of approximately 0.25 square kilometers and is based on infrared brightness temperature. Locations of lightning strikes are shown in yellow, as detected by the network of ground sensors that make up the World Wide Lightning Location Network. A flash is detected when five or more WWLLN stations around the world detect a radio-frequency atmospheric signal from the same lightning flash. A gray circle along the southern coast or center of Alaska represents the cities of Anchorage or Fairbanks, respectively.

The first part of the movie covers May 2019, and it is a period of little precipitation, little lightning, and few wildfires.

June 2019 shows an increasing amount of lightning but still few large fires. During June, the storms that do pass through central Alaska deliver only about half of the climatological normal amount of precipitation according to NOAA’s Climate Prediction Center.

At end of June and into July, things start to heat up. Numerous wildfires are present in Alaska even though regional storms reduced the intensity of some fires or put them out. One such storm passes through Alaska’s west coast on June 27 and another on July 1 near Fairbanks. During the first half of July, many wildfires burn. There is an absence of large storms coupled with significant lightning activity, which together contribute both to a dry fuel supply and lightning to ignite it.

By July 25, the U.S. Bureau of Land Management (BLM) reported that over 2 million acres of Alaska forests had burned so far this year, 98% of which were ignited by lightning rather than man-made fire sources. The area burned is equivalent to a square with sides 58 miles long.

Credits: For IMERG data, visit NASA’s Precipitation Measurement Missions (https://gpm.nasa.gov). The Visible Infrared Imaging Radiometer Suite (VIIRS) hot-spot data was downloaded from NASA’s Fire Information for Resource Management System (https://firms.modaps.eosdis.nasa.gov). Lightning data provided by University of Washington (https://www.wwlln.net). Climatological data provided by NOAA’s Climate Prediction Center (https://www.cpc.ncep.noaa.gov). Fire statistics from the Bureau of Land Management (https://fire.ak.blm.gov). Visualization by Owen Kelley at NASA Goddard’s Precipitation Processing System.

Categories
News

Large 7-day Accumulation over Western India (August 2019)

In early August 2019, a depression formed in the Bay of Bengal that moved over India contributing to heavy rainfall on India’s west coast. NASA’s satellite data analysis suggests that for August 5 though 11, two feet of rain fell in some places. This estimate is from the realtime multi-satellite algorithm called IMERG, which is run at NASA Goddard.

Categories
News

NASA Announces Release of 19-year Record of Global Precipitation (August 2019)

Larger image

The Global Precipitation Measurement (GPM) mission has released an improved version of a multi-satellite global precipitation-rate estimate. Using this algorithm, NASA has re-examined observations back to April 2000 to create a long-term archive of these high-quality rainfall and snowfall estimates. The algorithm is called IMERG, which stands for “The Integrated Multi-satelliE Retrievals for GPM.”

The IMERG algorithm stitches together the data an international constellation of satellite-borne sensors including infrared, passive microwave, and radar. The algorithm also uses estimate of tropospheric wind to morph precipitation observed at one time into data-sparse regions in earlier or later hours. The algorithm is the most sophisticated data-driven precipitation-estimation algorithm that NASA has ever developed, tested, and provided to the public. The current version of IMERG is designated Version 6.

The image above shows the earliest North Atlantic hurricane in the IMERG Version 6 2000-to-present archive, which is Hurricane Keith. Hurricane Keith formed in the Gulf of Mexico and reached category on the Saffir-Simpson scale before making landfall in Mexico. Using the QGIS application, this image was created from the Final IMERG Geographic Information System (GIS) daily product, a 24-hour summary of the 30-minute global 0.1 x 0.1 degree IMERG files. Both the original HDF5 files and these GIS TIFF translations together form the most popular data produce of the GPM mission, based on number of files that researchers download from NASA Precipitation Processing System (PPS).

To learn more about this data product, please read the Algorithm Theoretical Basis Document or visit the Global Precipitation Measurement (GPM) website. Since 2014, George Mason University’s Center for Earth Observing and Spatial Research (COESR0 employees working at NASA’s Precipitation Processing System (PPS) contributed to testing this algorithm and to creating the long-term archive of this algorithm’s output.

References:

NASA, 2019: The Integrated Multi-satelliE Retrievals for GPM (IMERG) Algorithm Theoretical Basis Document. 38 pp. Available online at https://pps.gsfc.nasa.gov/Documents/IMERG_ATBD_V06.pdf.

Kelley, O. 2019: The IMERG multi-satellite precipitation estimates reformatted as 2-byte GeoTIFF files for display in a Geographic Information System(GIS). Available online at https://pps.gsfc.nasa.gov/Documents/README.GIS.pdf.