Center for Earth Observing and Spatial Research

NASA Announces Release of 19-year Record of Global Precipitation (August 2019)

Larger image

The Global Precipitation Measurement (GPM) mission has released an improved version of a multi-satellite global precipitation-rate estimate. Using this algorithm, NASA has re-examined observations back to April 2000 to create a long-term archive of these high-quality rainfall and snowfall estimates. The algorithm is called IMERG, which stands for “The Integrated Multi-satelliE Retrievals for GPM.”

The IMERG algorithm stitches together the data an international constellation of satellite-borne sensors including infrared, passive microwave, and radar. The algorithm also uses estimate of tropospheric wind to morph precipitation observed at one time into data-sparse regions in earlier or later hours. The algorithm is the most sophisticated data-driven precipitation-estimation algorithm that NASA has ever developed, tested, and provided to the public. The current version of IMERG is designated Version 6.

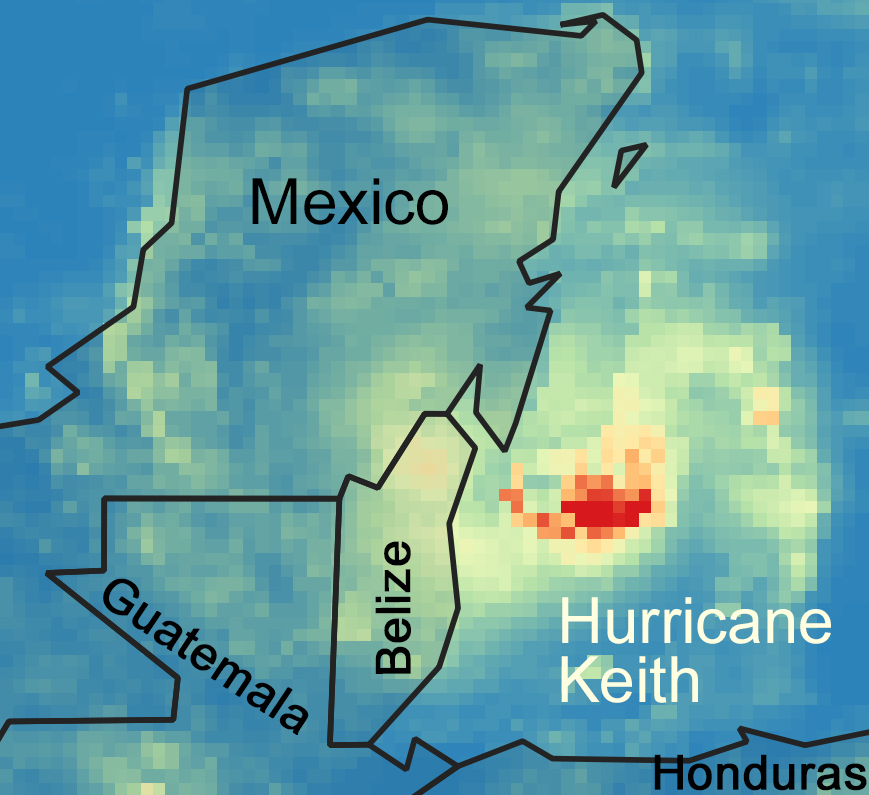
The image above shows the earliest North Atlantic hurricane in the IMERG Version 6 2000-to-present archive, which is Hurricane Keith. Hurricane Keith formed in the Gulf of Mexico and reached category on the Saffir-Simpson scale before making landfall in Mexico. Using the QGIS application, this image was created from the Final IMERG Geographic Information System (GIS) daily product, a 24-hour summary of the 30-minute global 0.1 x 0.1 degree IMERG files. Both the original HDF5 files and these GIS TIFF translations together form the most popular data produce of the GPM mission, based on number of files that researchers download from NASA Precipitation Processing System (PPS).

To learn more about this data product, please read the Algorithm Theoretical Basis Document or visit the Global Precipitation Measurement (GPM) website. Since 2014, George Mason University’s Center for Earth Observing and Spatial Research (COESR0 employees working at NASA’s Precipitation Processing System (PPS) contributed to testing this algorithm and to creating the long-term archive of this algorithm’s output.

References:

NASA, 2019: The Integrated Multi-satelliE Retrievals for GPM (IMERG) Algorithm Theoretical Basis Document. 38 pp. Available online at https://pps.gsfc.nasa.gov/Documents/IMERG_ATBD_V06.pdf.

Kelley, O. 2019: The IMERG multi-satellite precipitation estimates reformatted as 2-byte GeoTIFF files for display in a Geographic Information System(GIS). Available online at https://pps.gsfc.nasa.gov/Documents/README.GIS.pdf.

Fire and Ice: Intense Convection Observed at High Latitude by the GPM Satellite Radar and a Ground-based Lightning Network (Dec. 2018)

Books about lightning barely mention the polar regions, and books about polar regions don’t mention lightning.  There are societal impacts to the severe weather that often comes with lightning and with the forest fires that lightning can produce.  In Antarctica, climate and weather dynamics are poorly understood, and lightning studies might help identify the preferential locations for convective precipitation. In the present study, lightning storms located 60° to 67° from the Equator are examined using simultaneous observation of lightning and ice-phase precipitation, both produced by storm updrafts.  Hence, lightning is the “fire” and precipitation is the “ice.”

In December 2018, GMU researcher Owen Kelley and coauthors Jeremy Thomas, Natalia Solorzano, and Robert Holzworth (DigiPen Institute of Technology and University of Washington) presenting their finding about polar-region lightning at the American Geophysical Union’s annual conference.  Their presentation is available as a PDF file.

In thunderstorms 60°- 67° from the Equator, the lightning flash rate and the height that updrafts lift precipitation are seen to vary by hemisphere and by longitude.  At these high latitudes, the observations appear consistent between the GPM Dual-frequency Precipitation Radar (DPR) and the World Wide Lightning Location Network (WWLLN). Individual lightning storms are observed to have lightning that is co-located with areas of high-altitude radar echoes.  Four-year-total lightning flash counts and four-year-average radar-based precipitation characteristics show similar geographic variation.

Credits:

Kelley, O.A., J. N. Thomas, N. N. Solorzano, and R. Holzworth, 2018 Dec.: Fire and ice: Intense convective precipitation observed at high latitudes by the GPM satellite’s Dual-frequency Precipitation Radar (DPR) and the ground-based World Wide Lightning Location Network (WWLLN). poster presentation, H43F-2487, 2018 AGU annual meeting.

WWLLN data and antenna photograph provided by WWLLN / University of Washington.

A Quarter of a Million People View a Facebook Live Event about Hurricane Matthew (October 2016)

The day that Hurricane Matthew began interacting with the US East Coast, CEOSR research Owen Kelley and colleagues at NASA Goddard participated in a Facebook Live event on the NASArain Facebook page. On October 7, 2016, the discussion covered NASA observations of the hurricane and took live questions from viewers. Over 250,000 people viewed the event either during the live broadcast or afterward. The event is still viewable at https://www.facebook.com/NASARain/videos/1214008668661911/.

Update September 2021: As of the summer of 2021, posts related to the Global Precipitation Mission are now tweeted on the NASA Atmosphere twitter account rather than the NASA Rain twitter account.

Japan Launches Next-Generation NASA Satellite to Track Rain & Snow

http://www.space.com/24838-japan-launches-advanced-rain-snow-satellite.html

GPM Satellite Sees First Atlantic Hurricane

http://www.spacedaily.com/reports/NASA_JAXAs_New_Precipitation_Satellite_Sees_First_Atlantic_Hurricane_999.html

NASA and the Japanese Aerospace Agency Launch GPM Satellite

Invited Talk: Google, Using Google Earth for Near Real Time Natural Hazard Monitoring

NBC News: Bob Ryan used CEOSR data in his weather forecast