As Hurricane Ian impacts Florida and South Carolina, NASA IMERG algorithm provides estimates of Ian’s rainfall over both land and sea. CEOSR team members assist NASA with visualizing this data and with monitoring the performance of the IMERG algorithm. Such evaluations assist with improving the algorithm, a new version of which is due to be released later this year or in early 2023.
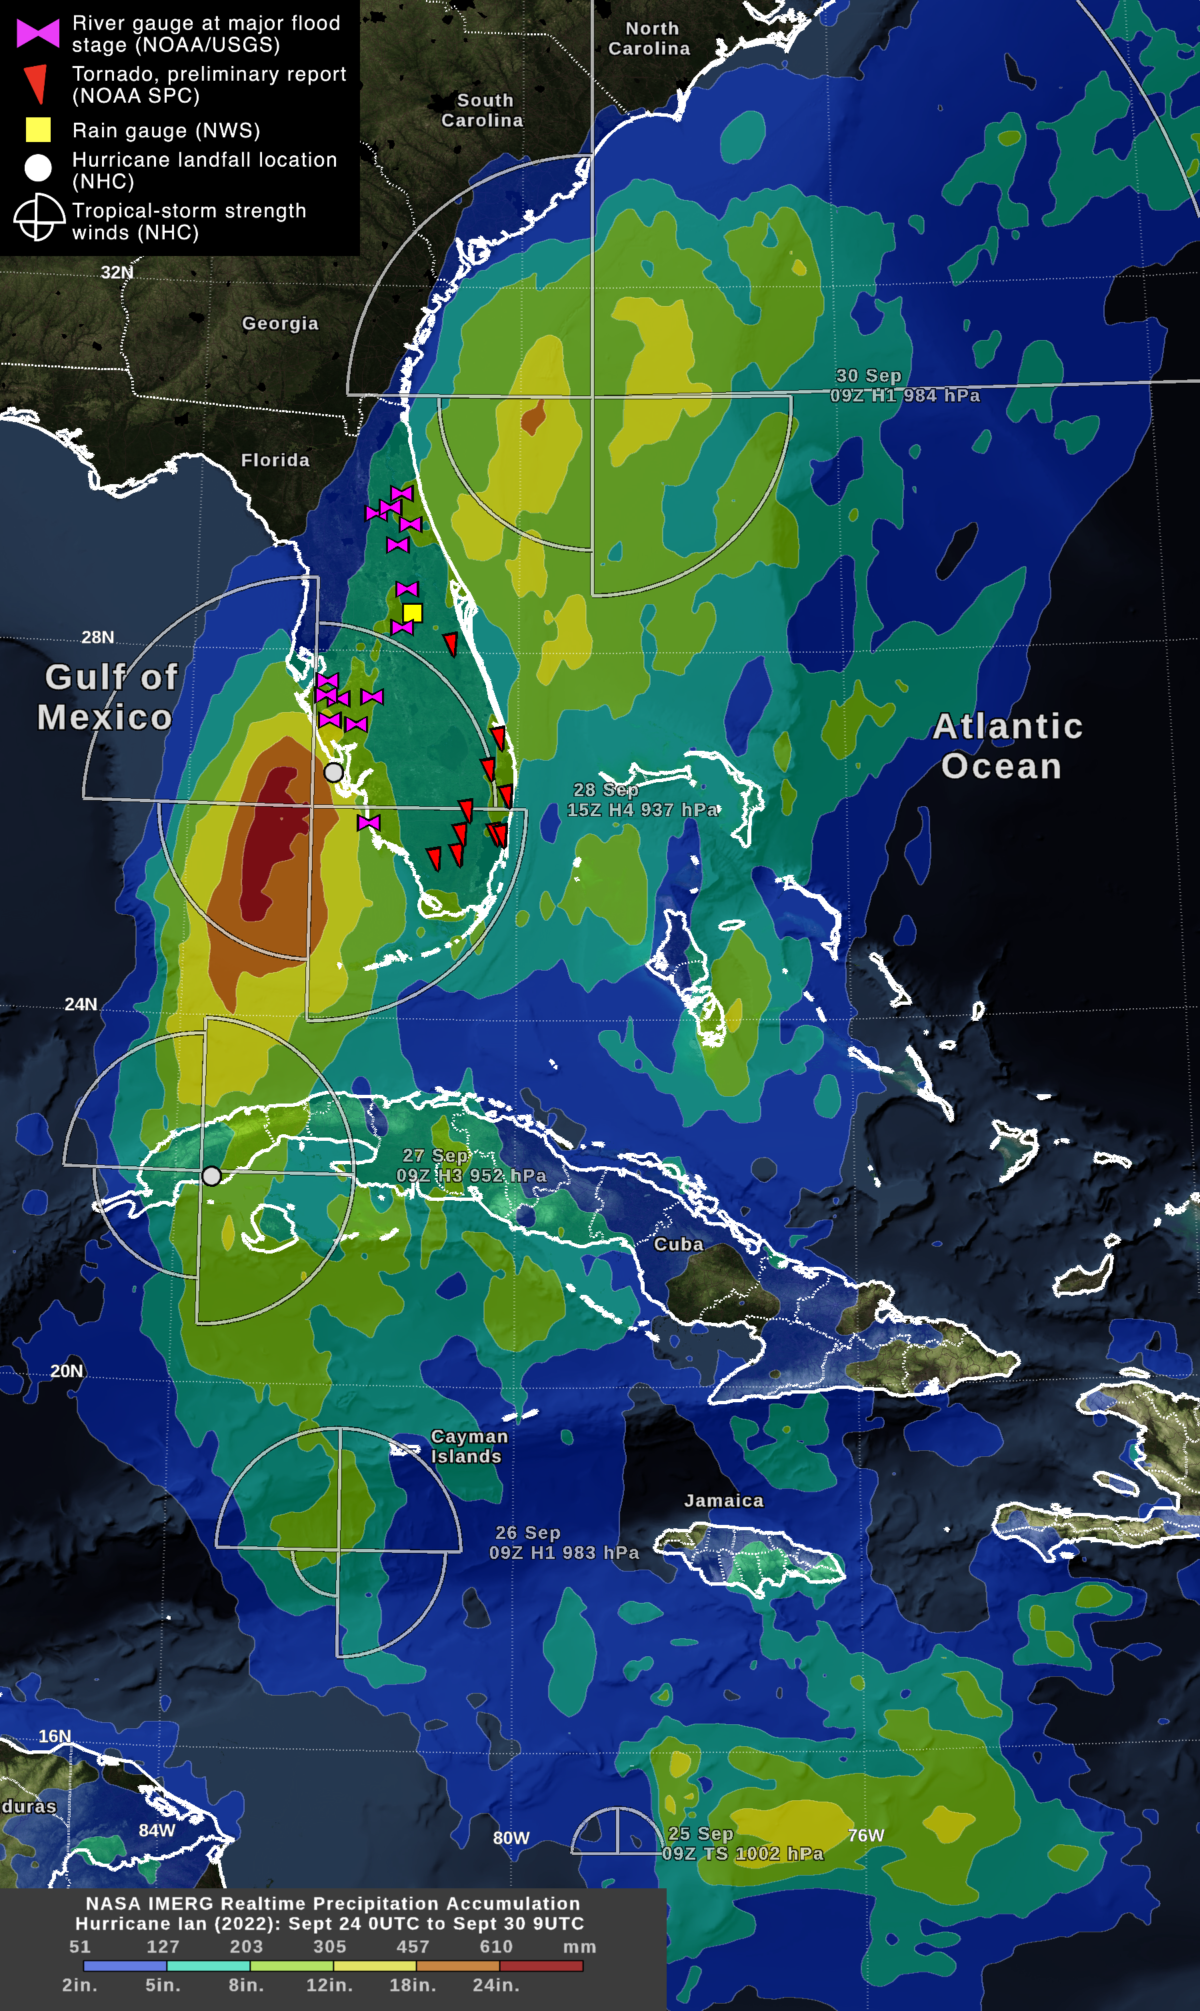
The image above shows the rainfall accumulation from Hurricane Ian from when it formed in the Caribbean on September 25, 2022, through when it approached the coast of South Carolina on September 30. On September 28 and 29, Ian cross Florida going west to east from Ft. Myers to Cape Canaveral.
The image also show the locations of tornadoes and river flooding in Florida that were associated with the passage of Hurricane Ian. There were preliminary reports of tornadoes over southern Florida the night before Ian’s Florida landfall, which are marked by red triangles in the image. The tornadoes were associated with a large, persistent band of heavy rain that maintained a position
to the east of Hurricane Ian’s inner core during the days prior to the Florida landfall.
On September 29, the day Ian left Florida, numerous USGS stream gauges reach major-flood stage, meaning significant economic damage was expected. These stream gauges are marked with purple
bows in the image. Florida’s inland flooding was caused by Ian’s heavy rainfall. Along the coast, storm surge contributed to the height of the flood water.
Lightning before Landfall
Prior to making landfall in Florida on September 28, Hurricane Ian intensified over the Gulf of Mexico. During this time, its inner core dropped a considerable amount of rain and also exhibited many lightning flashes. This period is show in the image below.
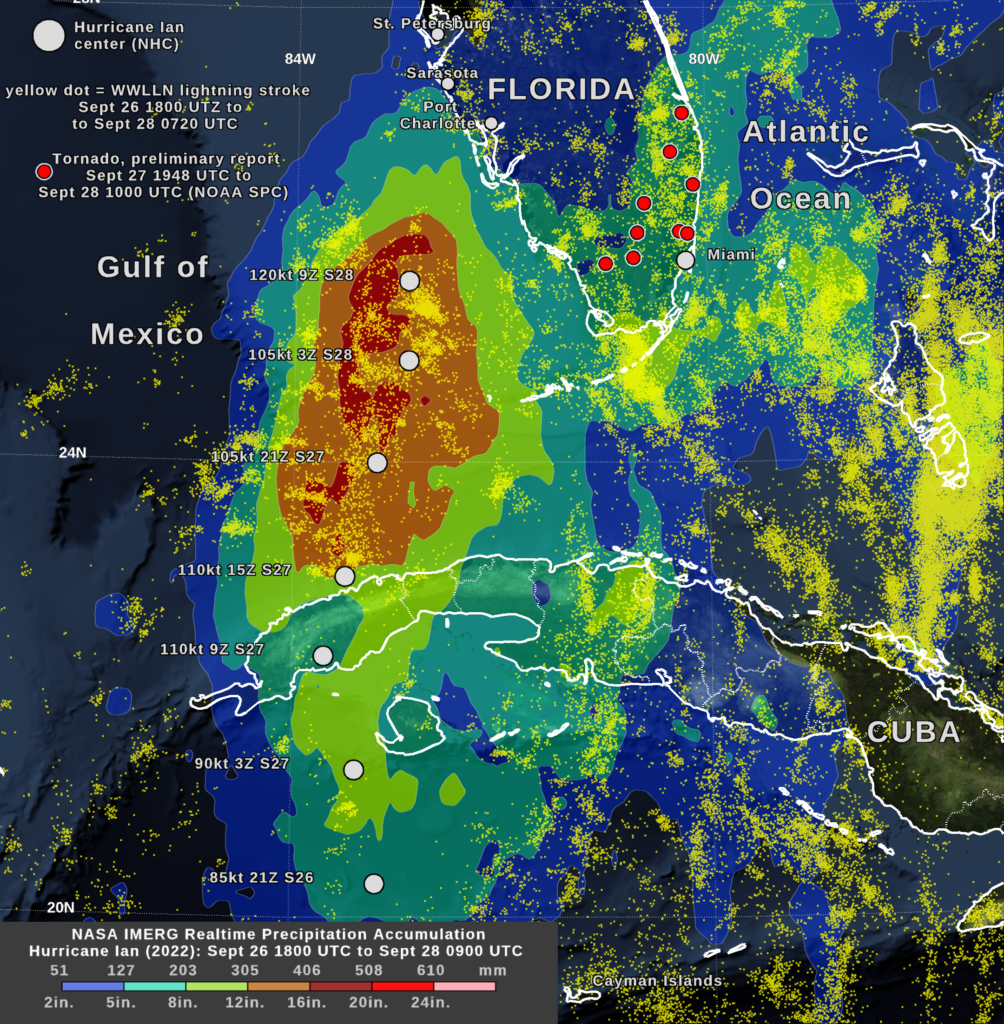
In the Gulf of Mexico, Ian’s eyewall was seen to contain particularly vigorous storm cells. Lightning was observed in Ian’s eyewall, whereas lightning had been near absent from Ian’s eyewall prior Ian passing over Cuba. Lightning strokes from the World Wide Lightning Location Network (WWLLN) are displayed in the image as small yellow dots. Over the Gulf of Mexico, the period of active eyewall lightning can be identified using the white dots in the image that indicate six-hourly locations of Hurricane Ian’s low-pressure center, as estimated by the National Hurricane Center.
Once in the Gulf of Mexico, Hurricane Ian intensified and underwent an eyewall replacement cycle early on September 28, according to the National Hurricane Center. During this period, NASA’s IMERG algorithm estimates that the rainfall accumulation under Ian’s inner core reached 12 to 20 inches. This accumulation is much higher than the 5-to-12-inch accumulation that Ian’s inner core had produced the day before, when the storm was located south of Cuba.
On September 27, stretching for several hundred miles to the east of Hurricane Ian’s inner core was a band of heavy rain storms and thunderstorms. These storms are seen in the IMERG rainfall accumulation, covering the southern tip of Florida during this period. During the night of September 27 and morning of September 28, these storms spawned a number of tornadoes according to preliminary reports from NOAA. These tornadoes are displayed as red dots in the image.
Credits: WWLLN data from the University of Washington with support from Jeremy Thomas and Natalia Solorzano at DigiPen Insitute of Technology and NorthWest Research Associates. Visualization Owen Kelley (CEOSR/NASA).